
Task 1.2: Flux tower and IR scintillometry
Objectives
Task 1.2 aims at developing the measurement of gas and energy exchanges between the soil, the vegetation and the atmosphere, in participating observatories. The soil-vegetation-atmosphere continuum represents the upper part of the critical zone. This is where the most intense and variable forcings occur, for a very wide range of space-time scales. It thus largely determines the functioning of the whole critical zone, and hence of energy and matter cycling.
Methods
Turbulent exchanges between the surface and the atmosphere are monitored at plot scale with the eddy-covariance method (“flux tower” implementing synchronous high-frequency measurement of the 3D wind vector and of transported scalar quantities: temperature, water vapor, carbon dioxide), and at catchment scale by scintillometry along the path of an electromagnetic beam from a transmitter to a receiver. To the measurement of sensible heat, water vapor (latent heat) and carbon dioxide fluxes is associated that of all other energy fluxes (radiative fluxes, and ground conduction) enabling verification of energy balance closure.
Deployments
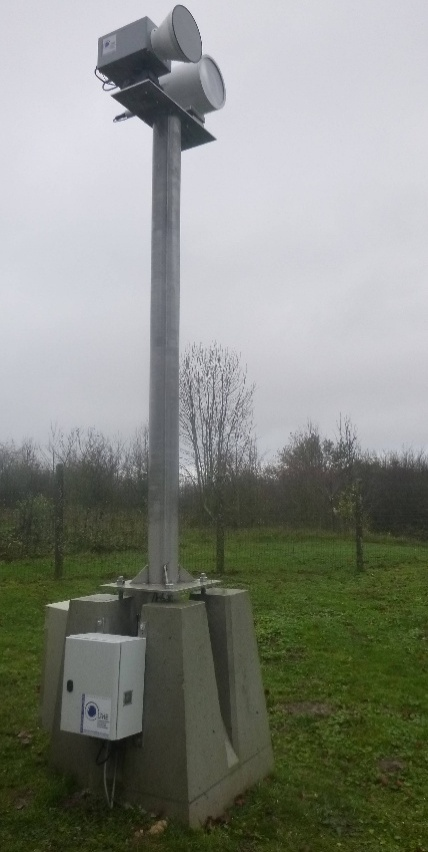
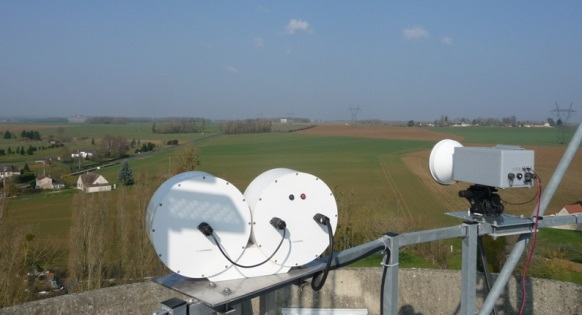
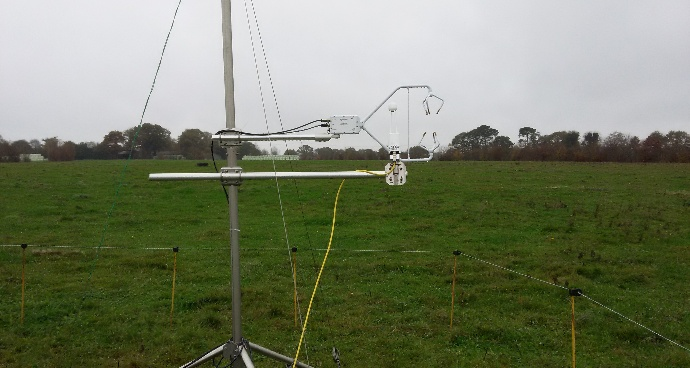
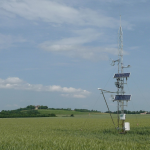
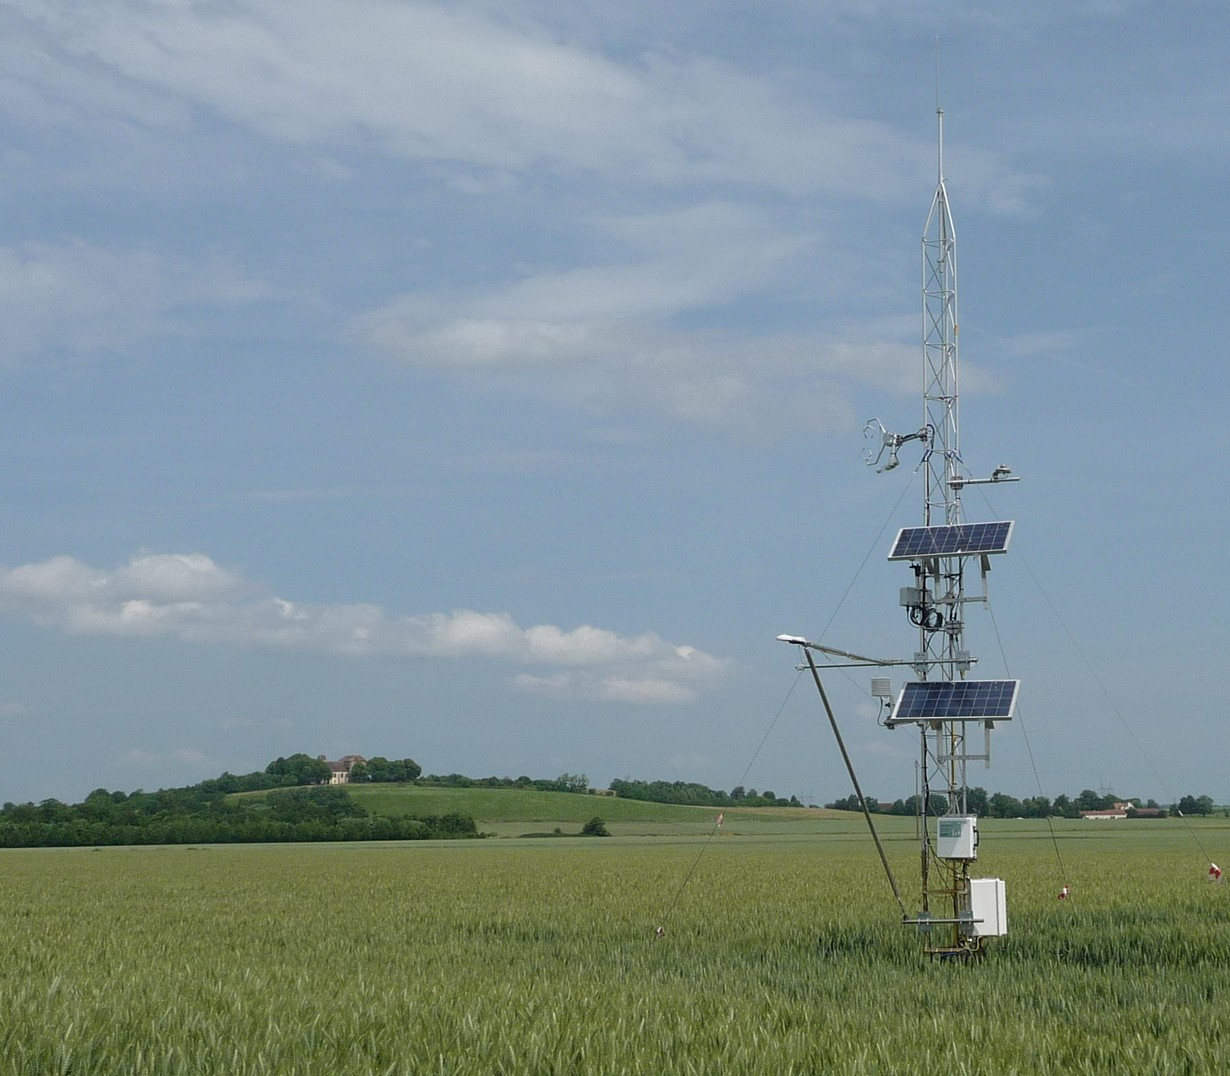
The first instrumented sites in the project are the Orgeval catchment (ORACLE observatory, Ile-de-France), and the Naizin site (AGRHYS observatory, Brittany). In the Orgeval catchment, a long-path (~5 km) infrared scintillometer is associated to a flux tower installed in a cultivated plot (rotation of corn, wheat, and legumes) and to an additional radiation balance station sampling a different crop in the rotation. The IR scintillometer is also coupled to the prototype microwave scintillometer set up as part of Task 1.1 of the project. At Naizin, a flux tower monitors a permanent grassland plot.
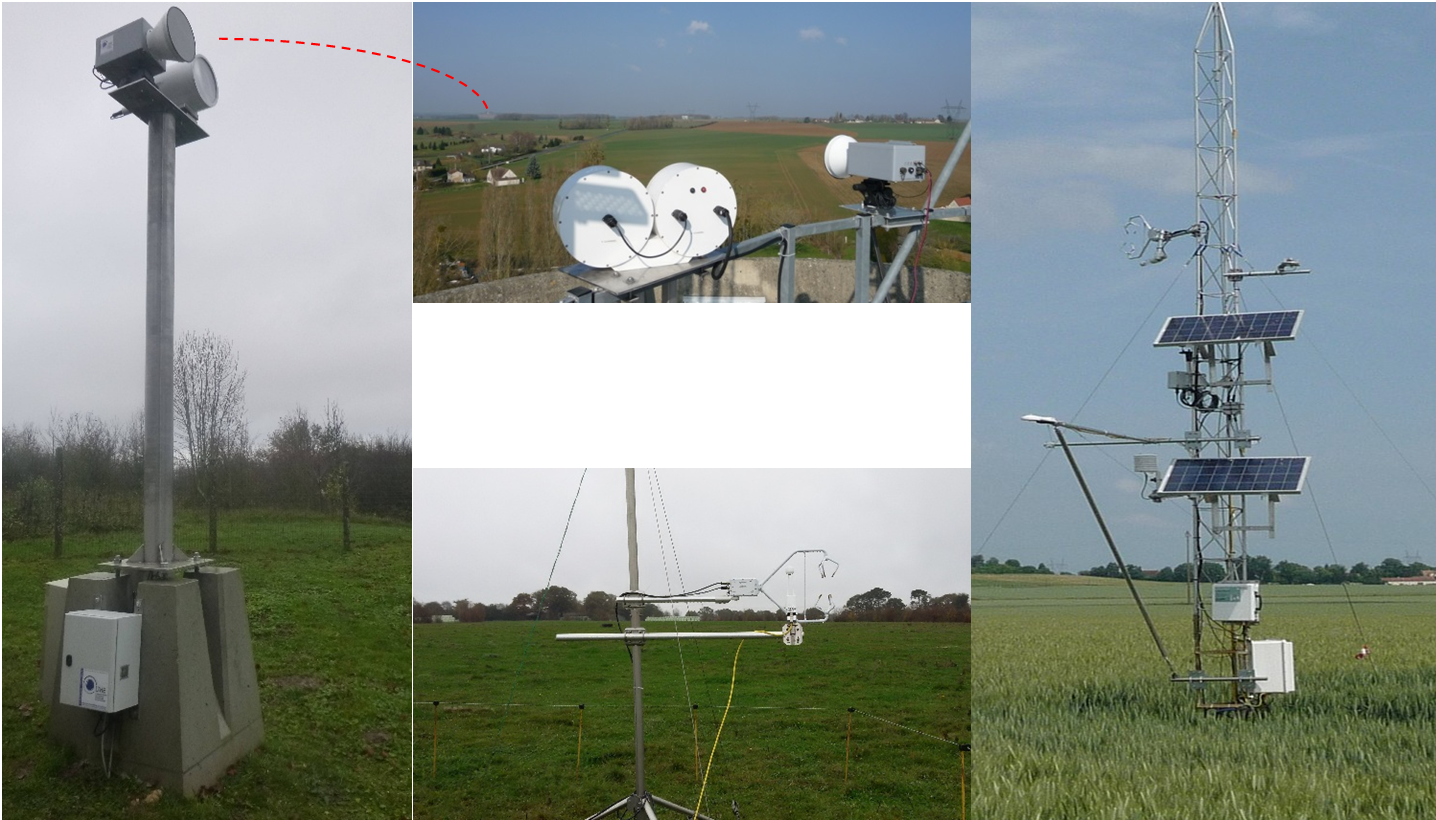
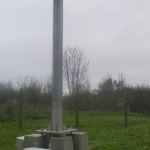
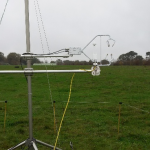
Top and left: transmitters and receivers of the infrared and microwave scintillometers installed in Orgeval catchment (the red dotted line shows the location of the receivers seen from the transmitters); Right: flux tower in Orgeval catchment (wheat crop in 2015); down: flux tower in the prairie plot at Naizin.
Data processing
Estimation of the turbulent fluxes from the raw data produced by the high-frequency sensors requires heavy and complex processing, based on the theory of transport by turbulent flow. Processing software was developed and produced first results, illustrated by the figures below respectively showing:
- top: daily cycles of turbulent fluxes in the Orgeval catchment for April and May 2015;
- bottom: temporal signatures of gas fluxes at the Naizin site, crossing the daily (horizontal axis) and seasonal (vertical axis) cycles over 2016.
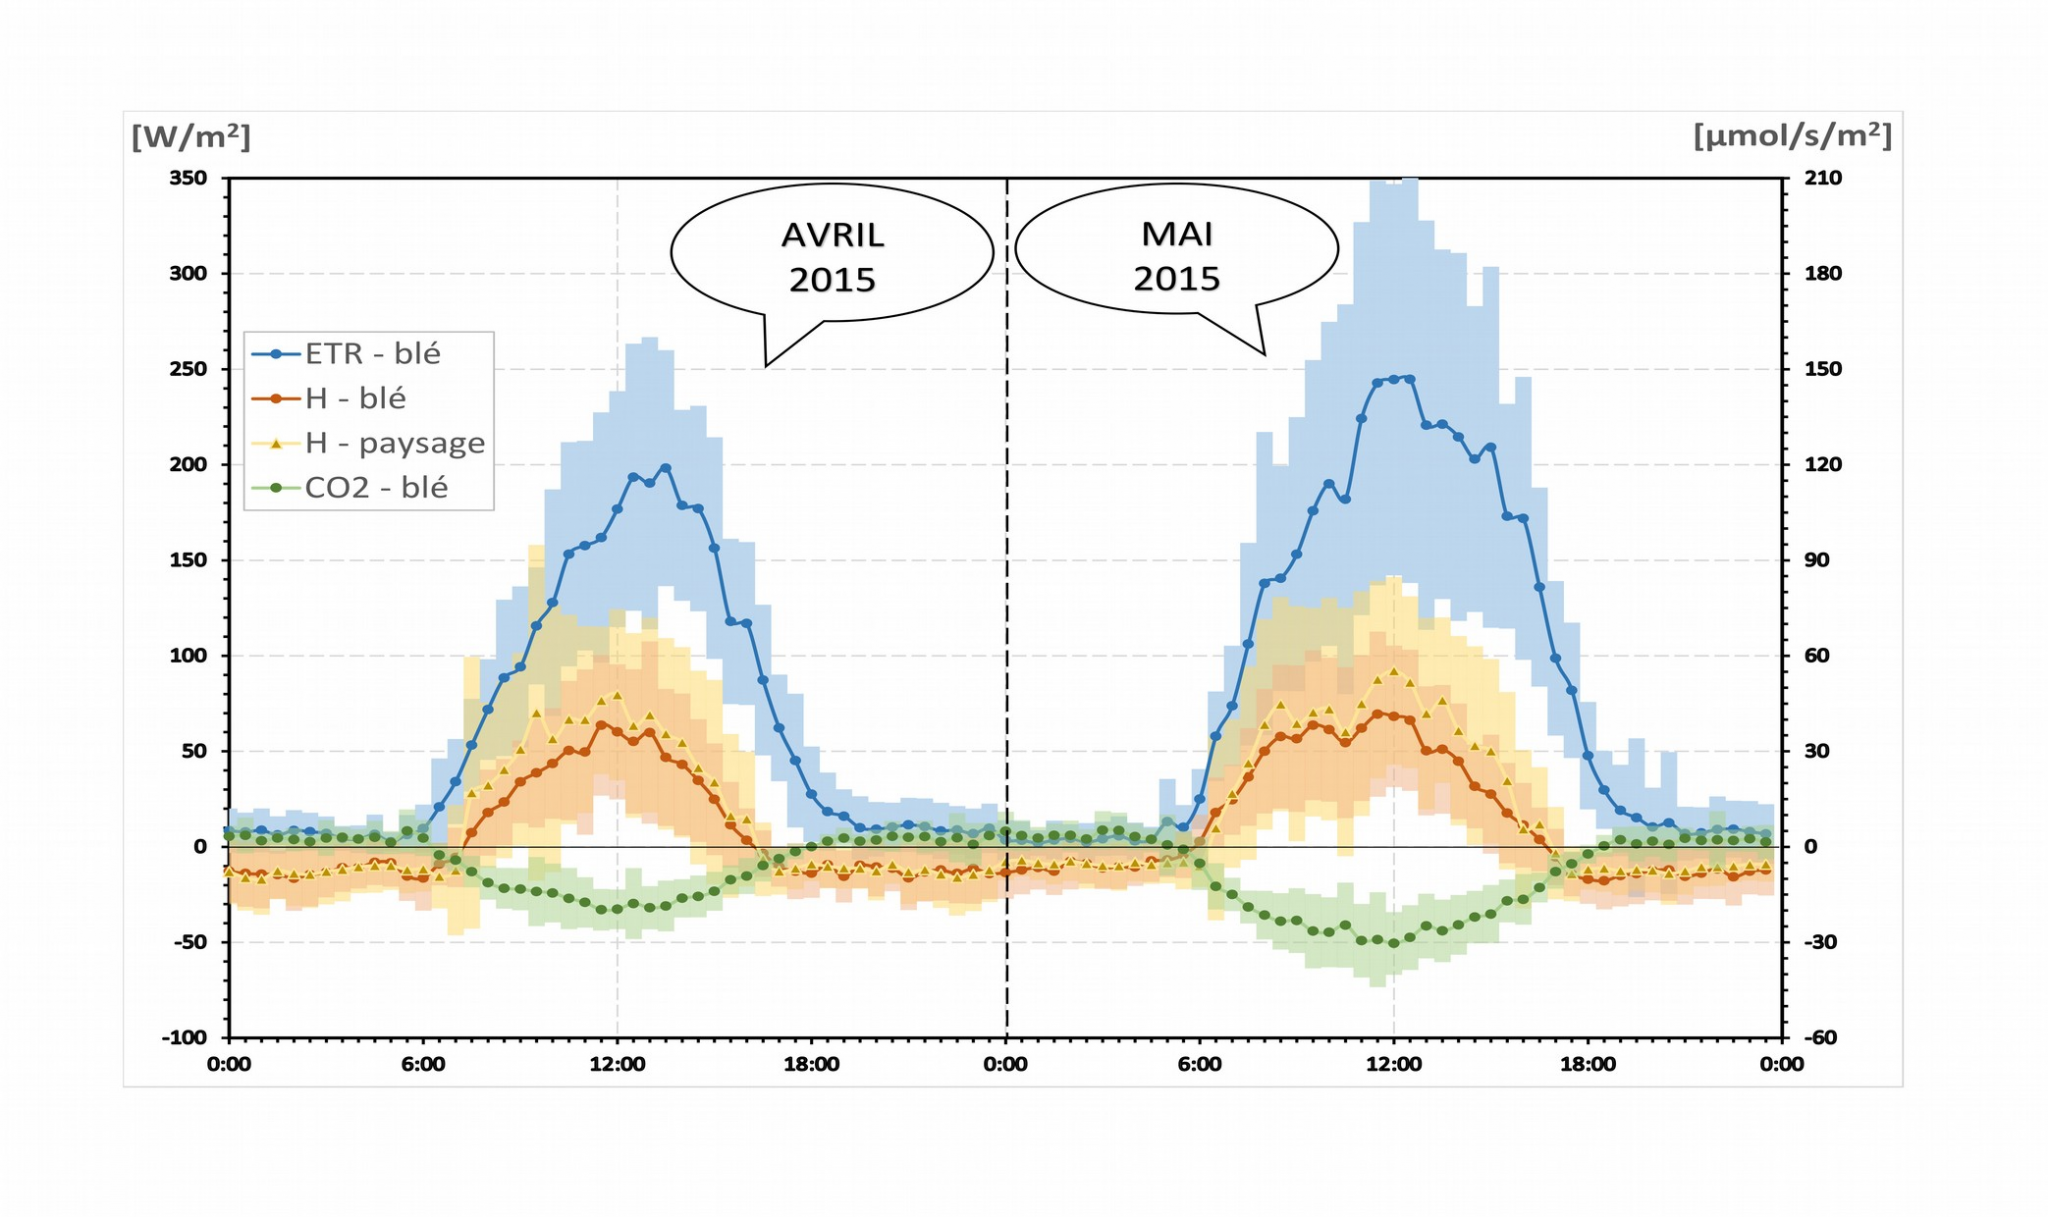
Monthly average and variability, for April and May 2015, in daily cycle of turbulent fluxes1 (ETR: evapotranspiration, H: sensible heat, CO2: carbon dioxide) in the Orgeval catchment, at the scale of a wheat plot (“blé”) or of the landscape (“paysage”), i.e., from the flux tower or the IR scintillometer, respectively.
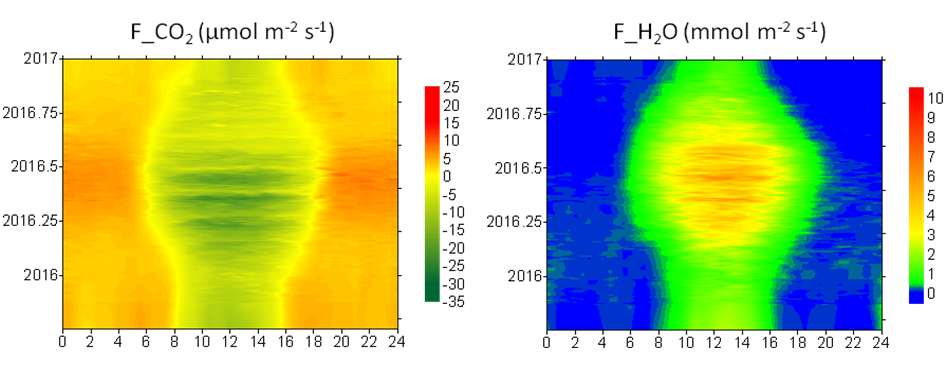
Temporal fingerprints of carbon dioxide and water vapor fluxes1 in the Naizin permanent grassland plot over 2016 (time of day in x, time of year in y).
(1. Positive fluxes from the surface to the atmosphere)
-
- emitters and receivers of the infrared and microwave scintillometers installed on Orgeval hydrogeological site
-
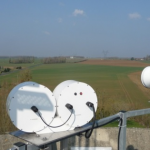
- emitters and receivers of the infrared and microwave scintillometers installed on Orgeval hydrogeological site
-
- flow tower on the prairie parcel in Naizin.
-
- WP 1.2
-
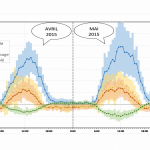
- Monthly averages and variability (April and May 2015) of turbulent flow daily cycles (ETR: evapotranspiration, H: sensible heat, CO2: carbon dioxide) in the Orgeval basin, at a wheat parcel or landscape scale.
-
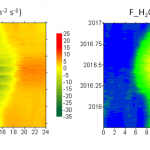
- Carbon dioxide and water vapor flux time signature on Naizin permanent grassland parcel in 2016

WP leaders: Bernard Cappelaere and Laurent Prevot