
Task 6.3: Electrical Resistivity Tomography (ERT)
Overview
At beginning in the 1990s, electrical resistivity tomography (ERT) began to be useful for environmental problems in order to understand the subsurface structure in 2D and 3D. This development is due to three major points:
- the achievement of reliable multi-electrode equipments,
- the improvement of IT tools,
- the development of robust inversion code
ERT has several advantages, the electrical resistivity is sensitive to the soil structure, to water content variations and clay content, thus it makes it possible to monitor hydrodynamic phenomena. The method is a valuable tool for upscaling processes from metric to kilometric scale, and down to at least 30 meters deep.
Measurement principle
The electrical resistivity is an intrinsic property that quantifies how strongly a given material opposes the flow of electric current. Knowing electrical resistivity allows allows to better understand subsoil structure and lithology. Indeed, the resistivity value may vary depending on the subsurface nature or the water content.
The electrical resistivity is a good parameter to study hydrogeological processes in the critical zone (infiltration, groundwater recharge, evaporation, etc.). The basic measurement is carried out by injecting a current (with two electrodes A and B) and measuring the resulting potential distribution (with two other electrodes (M and N). These two measurements allow us to calculate the apparent resistivity (ρa) for a given quadrupole. If the subsurface is homogeneous, the apparent resistivity equals the intrinsic resistivity of the medium. If the subsurface is heterogeneous, the current lines are distorted and of apparent resistivity differs from real resistivity (see figure below).
-
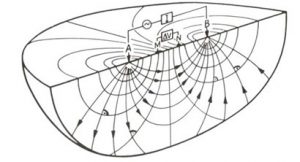
- Fig. 1: Measurement of the electrical resistivity, with 4 electrodes

-
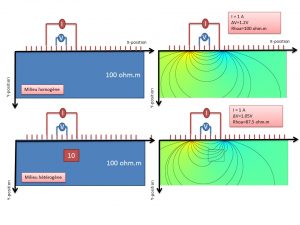
- Fig. 2: On the left ground electrical resistivity distribution, on the right electric fields resulting from the measurement. The lower apparent resistivity of 87.5 Ohm.m is due to the presence of a more conductive zone in the soil.

The electrical resistivity tomography proposed in the CRITEX program corresponds to the acquisition of several quadrupoles. To do it, electrodes with a regular electrode spacing are implemented on the surface (in line for 2D measurements, or with several parallel lines in 3D). To perfom the tomography, we have to vary the unit of electrode spacing of the quadrupole in order to investigate different depths (see Video below).
To obtain resistivity distributions in the subsurface, and not just the distribution of the apparent resistivity (that can be very different from the truth) it is necessary to use inversion procedures.
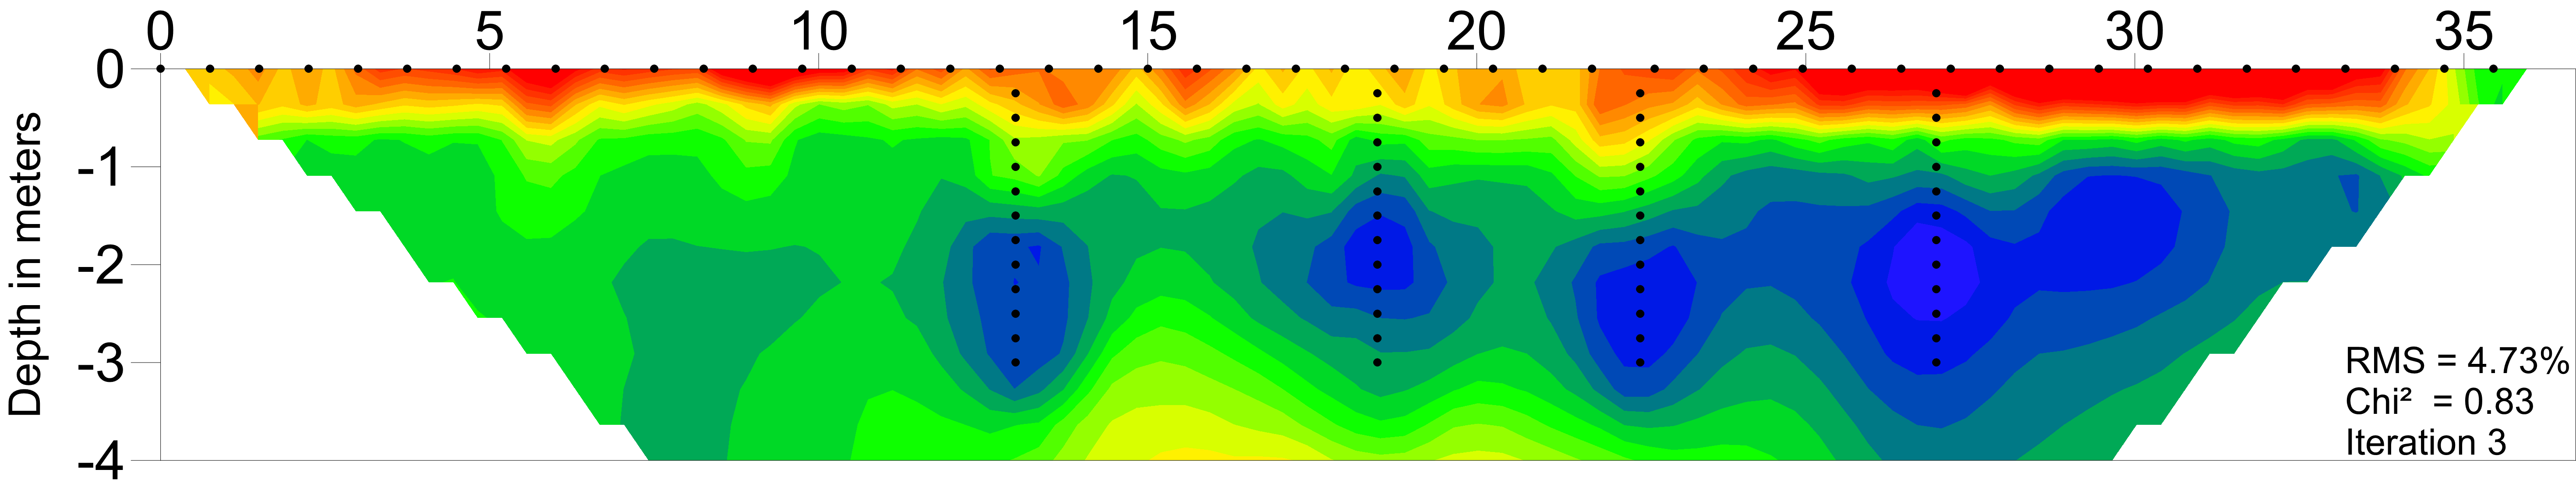
Fig. 4: 2D Inverse Electrical Resistivity Tomography
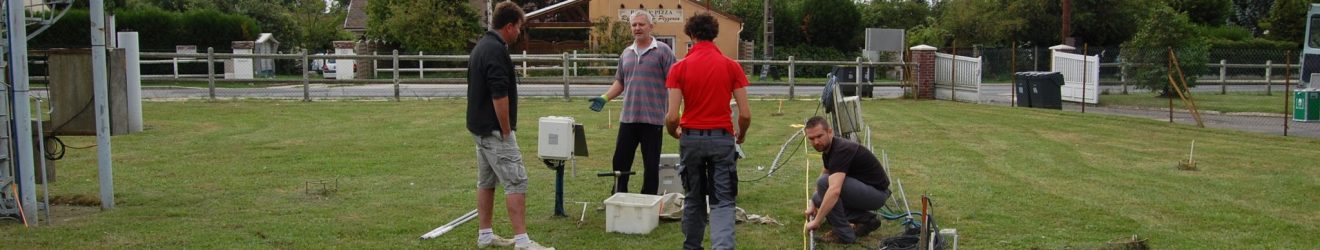
Equipment
As part of the CRITEX project, a SYSCAL PRO 72 Electrodes instrument manufactured by IRIS instruments was bought. The instrument is based at the IGE (http://www.ige-grenoble.fr/) in GRENOBLE and is available for the CRITEX community and ZC related projects. The instrument consists of a main unit, resistivity meter, connecting cables for electrodes, stainless steel electrodes. The equipment allows the acquisition of tomography profiles with 72 electrodes for a maximum spacing of 5 m allowing profiles up to 355m long for depths of 20 to 60m depending on the background resistivity (if the bachground is very conductive, the depth of investigation will be less).
-
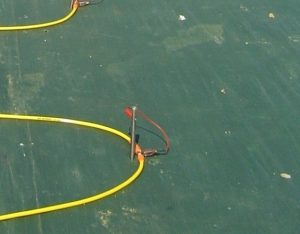
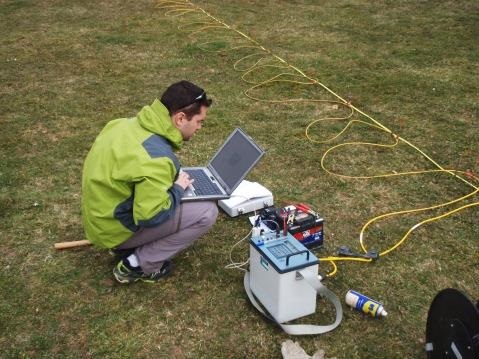
- Fig. 5: Electrode and equipment

-

- WP 6.3: Electrical Resistivity Tomography (ERT)
Possibility of applications in CRITEX
The method can be applied in the field for background electrical structure characterization (detection of the bedrock for example).
When used in time-lapse mode, it allows:
- Characterization of the aquifer recharge
- Monitoring of infiltration below the river
- Characterization of the slope infiltration processes
- Monitoring of microphenomena
The method is not recommended for investigations greater than 30-50 meters deep, and in general in cases where the user wishes for fine resolutions at depth. Besides, the parameter of resistivity has limitations because its value depends on multiple factors that must be identified.
The examples
Infiltration with drainage network on the Orgeval catchment.
ERT has the advantage of allowing anthropic or natural hydrological phenomena to be monitored. The above example shows infiltration through the drainage network on an agricultural plot. Using water injection into the drainage network combined with time-lapse ERT monitoring on an experimental field site makes it possible to monitor the evolution of the phenomenon and to locate the drainage network.
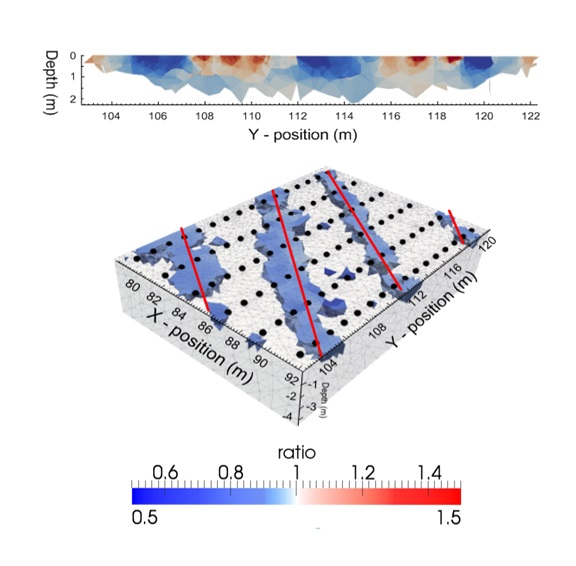
fig. 6 Water injection monitoring by electrical resistivity (Jouen et al., 2016)
Characterization of the recharge
In one of the RBV (AMMA Catch) watersheds in northern Benin, the method ERT used in time-lapse allows tracking of infiltrations into the riverbanks during the rainy season. The figure below illustrates this result by showing a) the electrical structure of the underground on the left, and b) the infiltration plume on the right bank. This technique was taught to CRITEX researcher at a summer school in Antony in 2014.
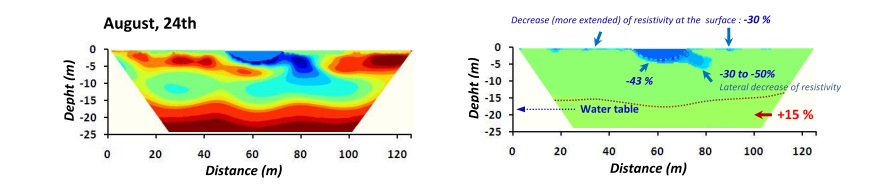
fig. 7: infiltration monitoring for the study of recharge
References
Wubda, M., Descloitres, M., Yalo, N., Ribolzi, O., Vouillamoz, J.M., Boukari, M.,, Hector, B.,Séguis, L., 2016. Time lapse electrical surveys to locate infiltration zones in weathered hardrocks tropical areas. accepted, Journal of Applied Geophysics, march 2017
Jouen, T., Clément, R., Henine, H., Chaumont, C., Vincent, B., Tournebize, J., 2016. Evaluation and localization of an artificial drainage network by 3D time-lapse electrical resistivity tomography (in press). Environ. Sci. Pollut. Res.
Contacts
- Marc DESCLOITRES (IGE, *protected email*)
- Rémi CLEMENT (IRSTEA, *protected email*)