WP 6.3 pictures
-
- WP 6.3: Electrical Resistivity Tomography (ERT)
-
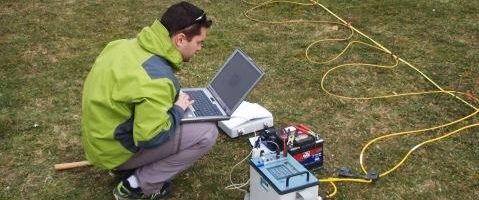
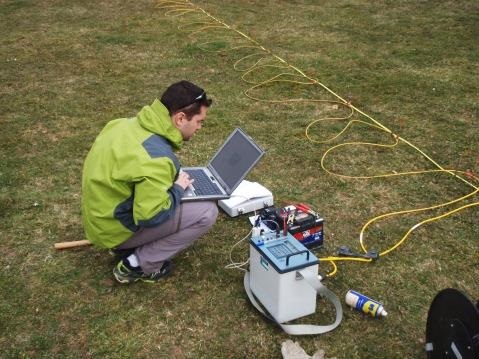
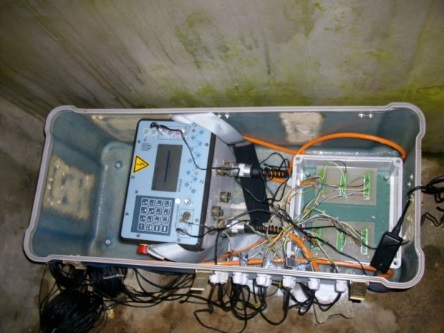
- Fig. 5: Electrode and equipment
-
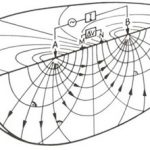
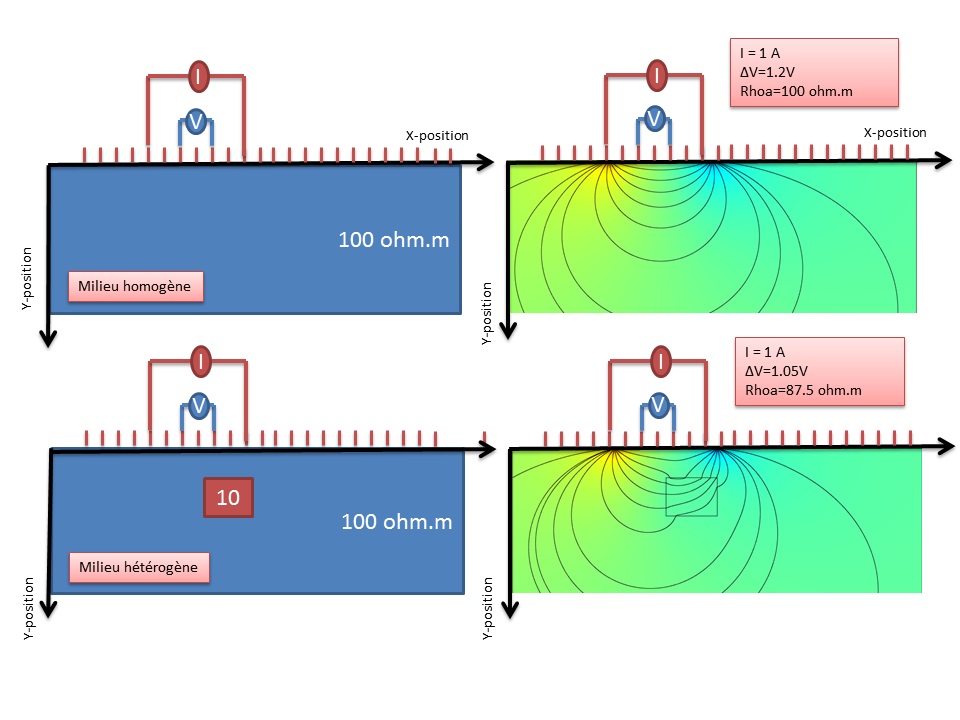
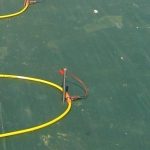
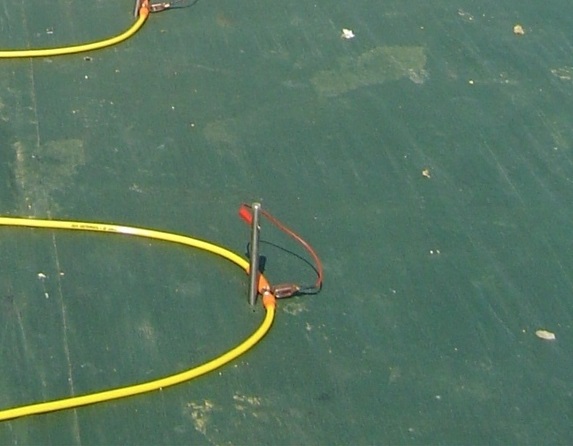
- Fig. 1: Measurement of the electrical resistivity, with 4 electrodes
-
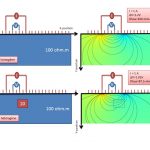
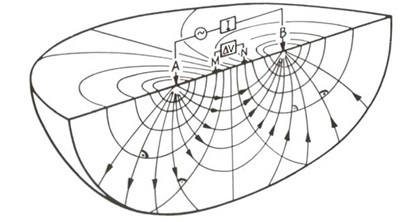
- Fig. 2: On the left ground electrical resistivity distribution, on the right electric fields resulting from the measurement. The lower apparent resistivity of 87.5 Ohm.m is due to the presence of a more conductive zone in the soil.