
2D characterization of near-surface VP/VS: surface-wave dispersion inversion versus refraction tomography

The joint study of pressure (P-) and shear (S-) wave velocities (VP and VS), as well as their ratio (VP/VS), has been used for many years at large scales but remains marginal in near-surface applications. For these applications, VP and VS are generally retrieved with seismic refraction tomography combining P and SH (shear-horizontal) waves, thus requiring two separate acquisitions. Surface-wave prospecting methods are proposed here as an alternative to SH-wave tomography in order to retrieve pseudo-2D VS sections from typical P-wave shot gathers and assess the applicability of combined P-wave refraction tomography and surface-wave dispersion analysis to estimate VP/VS ratio. We carried out a simultaneous P- and surface-wave survey on a well-characterized granite-micaschists contact at Ploemeur hydrological observatory (France), supplemented with an SH-wave acquisition along the same line in order to compare VS results obtained from SH-wave refraction tomography and surface-wave profiling. Travel-time tomography was performed with P- and SH- wave first arrivals observed along the line to retrieve VPtomo and VStomo models. Windowing and stacking techniques were then used to extract evenly spaced dispersion data from P-wave shot gathers along the line. Successive 1D Monte Carlo inversions of these dispersion data were performed using fixed VP values extracted from the VPtomo model and no lateral constraints between two adjacent 1D inversions. The resulting 1D VSsw models were then assembled to create a pseudo-2D VSsw section, which appears to be correctly matching the general features observed on the VStomo section. If the VSsw pseudo-section is characterized by strong velocity uncertainties in the deepest layers, it provides a more detailed description of the lateral variations in the shallow layers. Theoretical dispersion curves were also computed along the line with both VStomo and VSsw models. While the dispersion curves computed from VSsw models provide results consistent with the coherent maxima observed on dispersion images, dispersion curves computed from VStomo models are generally not fitting the observed propagation modes at low frequency. Surface-wave analysis could therefore improve VS models both in terms of reliability and ability to describe lateral variations. Finally, we were able to compute VP/VS sections from both VSsw and VStomo models. The two sections present similar features, but the section obtained from VSsw shows a higher lateral resolution and is consistent with the features observed on electrical resistivity tomography, thus validating our approach for retrieving VP/VSratio from combined P-wave tomography and surface-wave profiling.
Copyright © EAGE Publications bv 2015
DOI: 10.3997/1873-0604.2015028
(Sylvain Pasqueta1, Ludovic Bodet1, Laurent Longuevergne2, Amine Dhemaiec3, Christian
Camerlynck1, Faycal Rejiba1, Roger Guérin1)
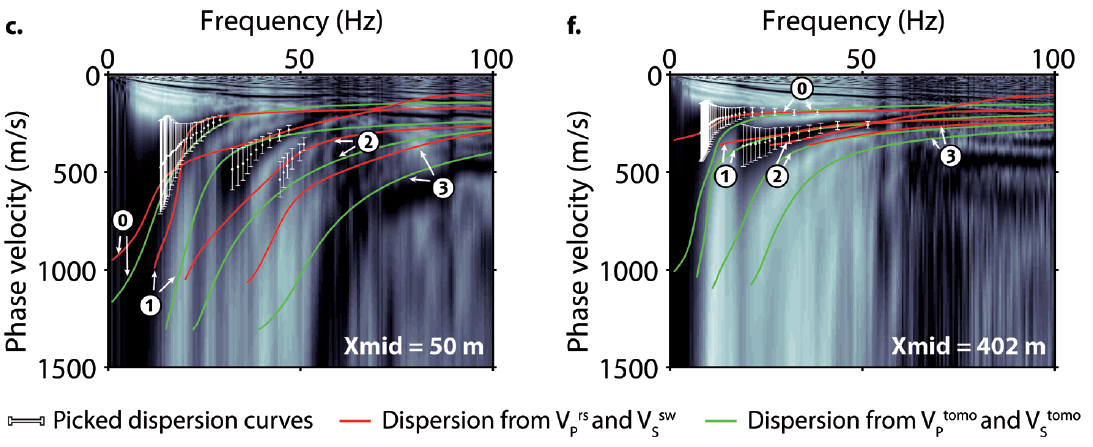
1D VS models obtained from SH-wave refraction interpretation (VStomo, green solid line) and surface-wave dispersion inversion (VSsw, red solid line) at Xmid = 50 m (a) and Xmid = 402 m (d). 1D VP models obtained from P-wave refraction tomography (VPtomo, green dashed line) and resampled to follow the layering of VSsw (VPrs, red dashed line) are also represented in (a) and (d). 1D VP/VS models constructed from VSsw and VPrs (VPrsIVSsw, red solid line) and from VPtomo and VStomo (VPtomoIVStomo, green solid line) at Xmid = 50 m (b) and Xmid = 402 m (e). The water table level is represented with a black dashed line.
Download: WP61_NSG_Pasquet_Ploemeur2