
Contribution of the finite volume point dilution method for measurement of groundwater fluxes in a fractured aquifer
Measurement of groundwater fluxes is the basis of all hydrogeological study, from hydraulic characterization to the most advanced reactive transport modeling. Usual groundwater flux estimation with Darcy’s law may lead to cumulated errors on spatial variability, especially in fractured aquifers where local direct measurement of groundwater fluxes becomes necessary. In the present study, both classical point dilution method (PDM) and finite volume point dilution method (FVPDM) are compared on the fractured crystalline aquifer of Ploemeur, France. The manipulation includes the first use of the FVPDM in a fractured aquifer using a double packer. This configuration limits the vertical extent of the tested zone to target a precise fracture zone of the aquifer. The result of this experiment is a continuousmonitoring of groundwater fluxes that lasted for more than 4 days.
Measurements of groundwater flow rate in the fracture (Qt) by PDM provide good estimates only if the mixing volume (Vw) (volume of water in which the tracer is mixed) is precisely known. Conversely, the FVPDM allows for an independent estimation of Vw and Qt, leading to better precision in case of complex experimental setup such as the one used. The precision of a PDMdoes not rely on the duration of the experiment while a FVPDM may require long experimental duration to guarantees a good precision.
Classical PDM should then be used for rapid estimation of groundwater flux using simple
experimental setup. On the other hand, the FVPDM is a more precise method that has a great potential for development but may require longer duration experiment to achieve a good precision if the groundwater fluxes investigated are low and/or the mixing volume is large.
© 2015 Elsevier B.V. All rights reserved.
(P. Jamin1, P. Goderniaux2,3, O. Bour2, T. Le Borgne2, A. Englert4, L. Longuevergne2, S. Brouyère1)
Experimental data (gray points) and adjusted analytical solutions (black crosses) of FVPDMno.
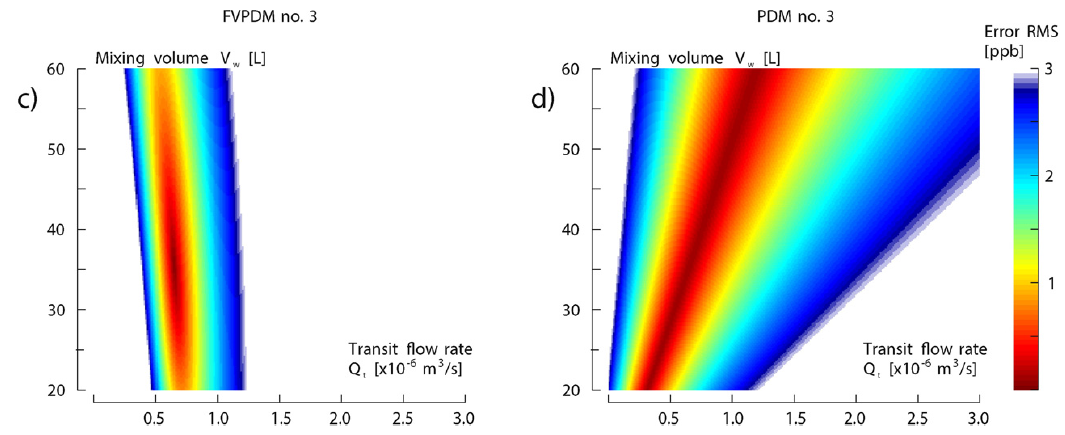
(c) and (d) are the RMS error plot for the FVPDM and PDM experiments for the adjustment of the mixing volume and the groundwater transit flow rate. A unique pair of Qt/Vw value fits the FVPDM equation (Vw = 35.6 L, Qt = 7.43 × 10⁻⁶m3/s). On the contrary, a wide range of Qt/Vw pairs that satisfies the PDM equation without being able to determine a most probable one (Qt/Vw = 2.12×10⁻⁴ s−1). Note the oscillations of tracer concentration in the well (sequential plateaus) at the beginning of FVPDM and PDM experiment.
Download: WP72_JCH_Jamin_Ploemeur
- University of Liège, Fac. Applied Sciences, Dpt ArGEnCo, Geo3-Hydrogeology and Environmental Geology, Building B52, 4000 Sart Tilman, Belgium
- Géosciences Rennes (UMR CNRS 6118)-OSUR, University of Rennes 1, Rennes, France
- University of Mons, Department of Geology and Applied Geology, Mons, Belgium
- Ruhr-Universität Bochum, Geology, Mineralogy and Geophysics, Bochum, Germany